Canada’s federal ministries, along with the Canadian Radio and Television Commission (CRTC), have devised a National Broadband internet Service Availability Map (ISAM)7 to show the level of broadband services available in any part of Canada. This map uses a combination of data sources. The data is collected in partnership between the CRTC and the Ministry of Innovation, Science and Economic Development through annual surveys and ongoing consultation with key stakeholders, including ISPs, federal partners, industry associations, provinces and others8. This is now used as a standard map of services for many internet bandwidth improvement projects and grant funding programs.
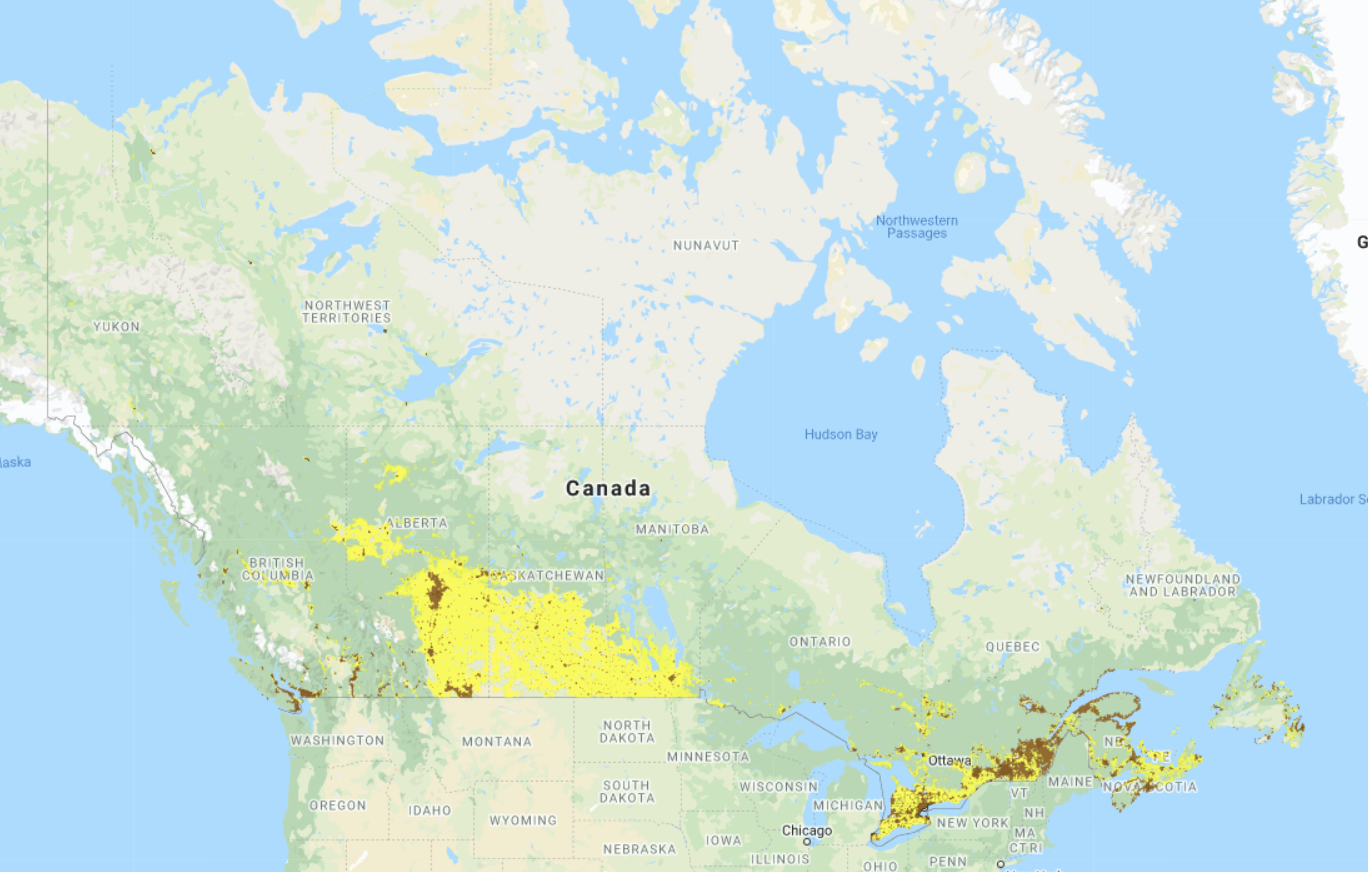
Figure 3. National Broadband Internet Service Availability Map of Canada. Source: Innovation, Science and Economic Development Canada9 Orange to brown regions indicate increasing percentages of 50/10 Mbps availability. Yellow regions have at least 5/1 Mbps available, as per the legend in Figure 4.
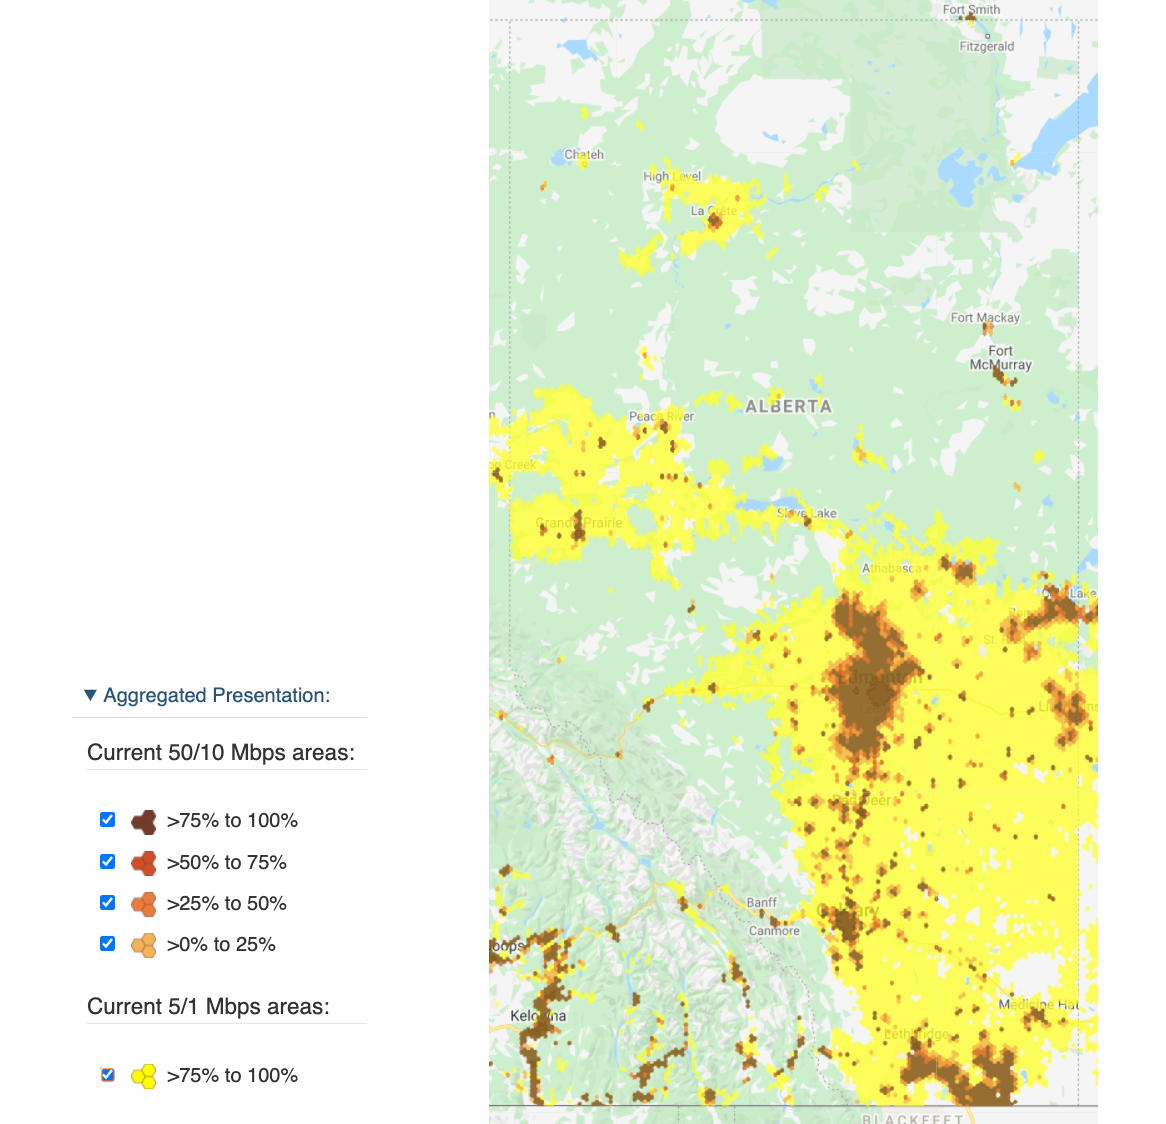
Figure 4. National Broadband Internet Service Availability Map of Alberta. Source: Innovation, Science and Economic Development Canada10.
Despite the best efforts of the creators behind ISAM, it is unable to achieve a level of granularity to detail the actual levels of service available in a given geographic region, particularly rural areas. For example, in Sturgeon County, immediately north of Edmonton, the national map shows the majority of the county as being fully served at 50/10 Mbps or better, and the remainder at a minimum of 25/5 Mbps (see Figure 5). And yet, many farmers and acreage owners in the county are significantly underserved. This can be shown from data captured by the Canadian Internet Registration Authority (CIRA) using its Internet Performance Test (IPT)11.
CIRA is a non-profit organization tasked with maintaining internet domains in Canada, along with a host of other related services. Its IPT service allows internet subscribers to test the actual bandwidth performance of their internet. It is independent of any other data, such as those used by ISAM, and provides real-time data capture. The speed test data CIRA produces comes from hundreds of thousands of data points from around the country.
Cybera acquired CIRA’s IPT data for Alberta for the years 2019 and 2020, and has used samples of this data to determine the accuracy of the ISAM information. It should be noted that individual network tests are not always a good indicator of a given network’s performance. This is because bandwidth and other network performance indicators — such latency and jitter (lag in data packet delivery and consistent flow of data) — can be dependent on many factors. Nevertheless, the volume of results in a given area from the IPT data can produce averages based on different locations on different connection types and different times of the day and the season. This data then is very telling.
Below is a section of Sturgeon County captured from the ISAM website. When zooming in from the large-scale maps, you get what ISAM calls “Rural Road Coverage”, as shown in Figure 5. This shows expected service levels available along these roads, which means the entire area is identified as having service levels at a minimum of at least 25/5 Mbps, if not 50/10 Mbps.
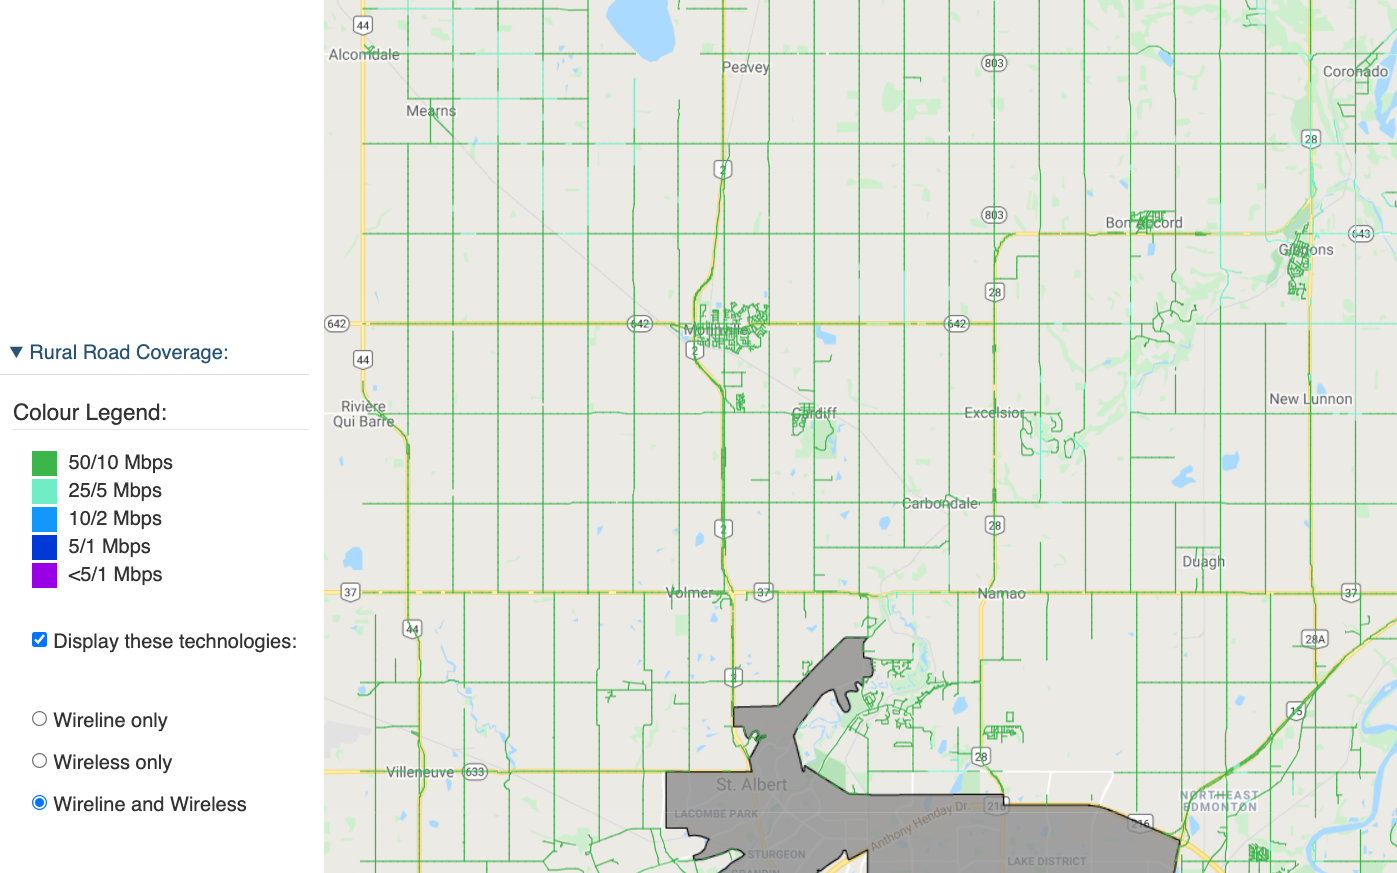
Figure 5. Zoomed-in area of the National Broadband Internet Service Availability Map (ISAM). This shows a portion of Sturgeon County immediately north of Edmonton and St. Albert (grey areas). The Rural Road Coverage shows green lines along the roads indicating full coverage of 50/10 Mbps in the county. Source: Innovation, Science and Economic Development Canada12.
Compare that view of the area with the data provided by CIRA’s IPT data, shown in Figure 6. Using the same legend as ISAM, the results show a much more diverse level of service availability, with a number of locations getting results at less than 5/1 Mbps service availability.
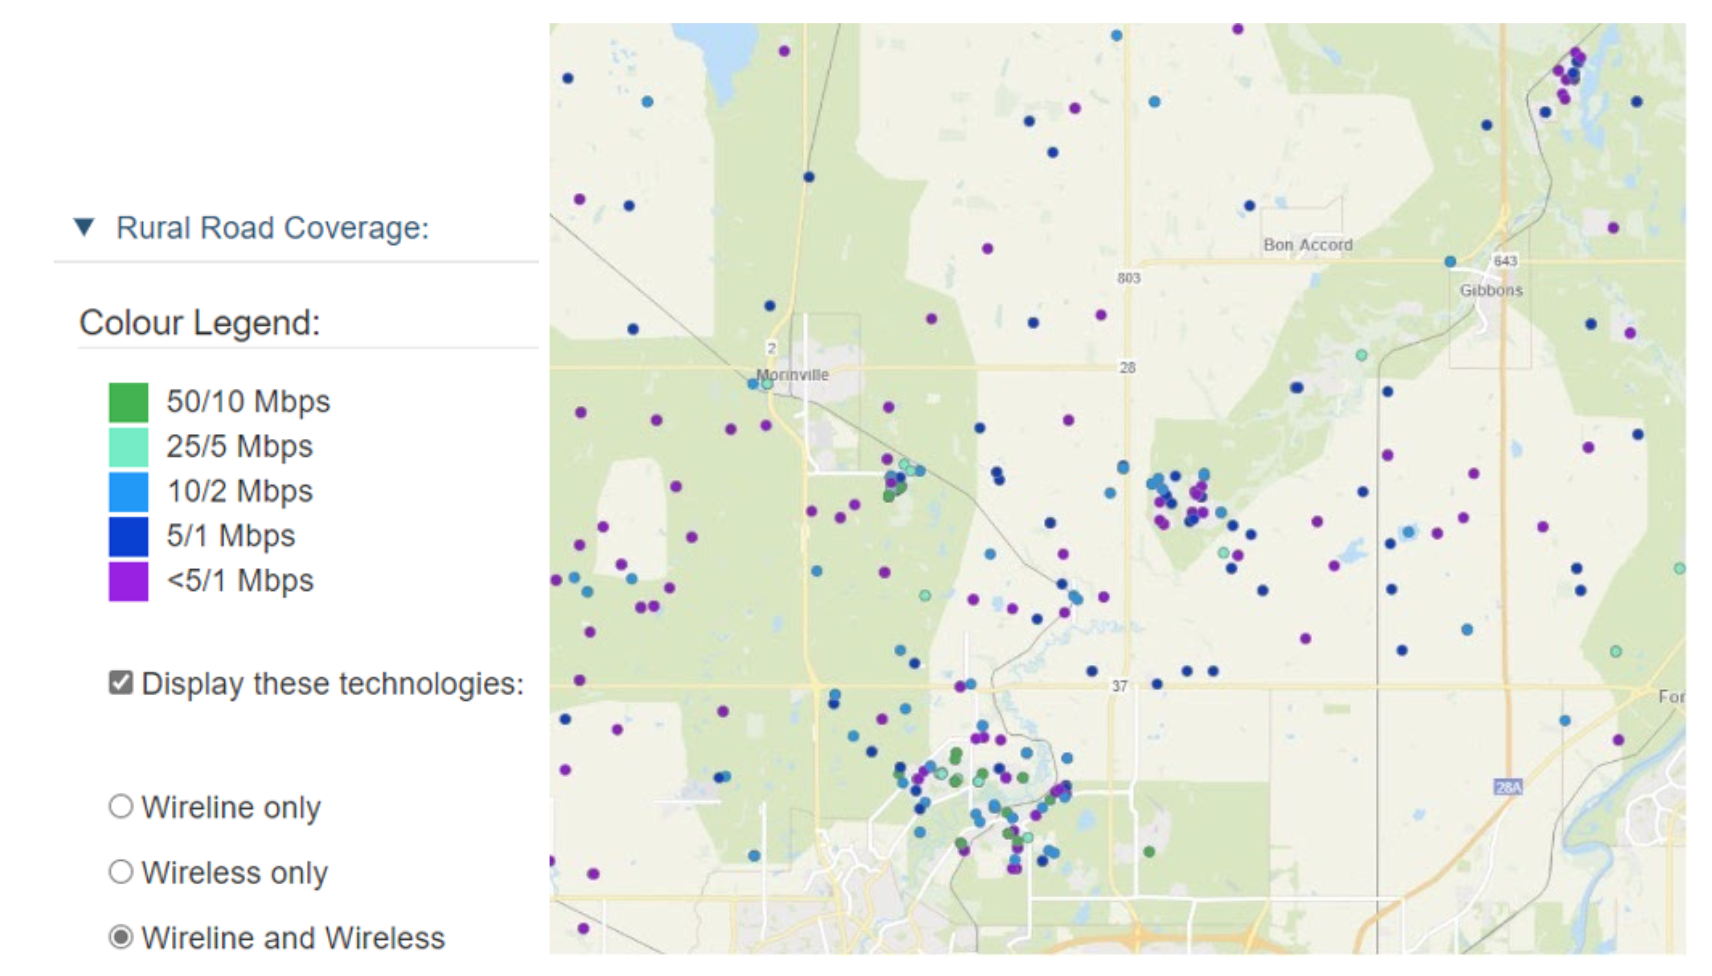
Figure 6. CIRA’s Internet Performance Test (IPT) data shows the same section of Sturgeon County as Figure 5, with test results from individual source locations. There are many data points showing less than 50/10 Mbps and even well below 25/5 Mbps as shown in the ISAM image. Source: Canadian Internet Registration Authority IPT data13.
The CRTC Communications Monitoring Report (Table 1) shows broadband availability percentages for Alberta based on the ISAM data, which gives a broad strokes picture of broadband coverage. CIRA’s IPT data can help improve the granularity of the actual broadband service availability in any specific geographic region. Using both of these tools to analyze broadband service availability for a given region, say, to apply for grant funding opportunities, should greatly improve the understanding of the actual availability in any region. This will be further discussed in the Future Needs and Opportunities section of this report.
References
7Innovation, Science and Economic Development (ISED) Canada. National Broadband Internet Service Availability Map.
8ISED. National Broadband Data Information - Get connected (ic.gc.ca).
9ISED. National Broadband Internet Service Availability Map. Accessed 15 June 2021.
10ISED. National Broadband Internet Service Availability Map. Accessed 15 June 2021.
11Canadian Internet Registration Authority (CIRA). Internet Performance Test | CIRA.
12ISED. National Broadband Internet Service Availability Map. Accessed 15 June 2021.
13CIRA Performance Test data from 2019 and 2020.