Alberta’s broadband availability as of 2019 is shown in Table 1. As the table demonstrates, practically the entire province (99.7%) has access, at least minimally, to 5 Mbps download speed. The percentage of Albertans able to access the current acceptable standard for high-speed internet — 50 Mbps download and 10 Mbps upload — is 87.8%. This is slightly higher than the Canadian average of 87.4%.
Table 1 6. Broadband Availability in Alberta by Download Speed, 2019 per CRTC Communications Monitoring Report 2020
Prepared by Cybera using data from 2015 CRTC Communications Monitoring Report. These figures exclude satellite technologies.
Download Speed | Availability |
5.0 - 24.9 | 99.7 |
25.0-49.9 | 98.6 |
50.0-99.9 | 94.7 |
50/10 & Unlimited Data Transfer | 87.8 |
100.0 – 999.9 + | 83.6 |
1,000 (Gigabit) | 33.5 |
Source: Prepared by Cybera using data from 2020 CRTC Communications Monitoring Report. These figures exclude satellite technologies.
However, accurately assessing the current state of broadband services in Alberta is difficult, not least because it is a constantly moving target. Internet Service Providers are often reluctant to give out accurate figures of actual service delivery throughout their service area. Using their advertised services gives an idea of service availability, but in rural areas, this ideal scenario rarely plays out in reality.
Determining accurate broadband speeds for Alberta: the Sturgeon County case study
The Connecting Canadians initiative also created a national broadband coverage map15 (see Figures 3 & 4), with input from ISPs, to identify the areas of Canada that have underserved (< 5 Mbps download speed) or unserved broadband needs. The CRTC released a similar map (see Figures 5 and 6) in April 2016. It depicts the availability of broadband internet access service at or above the CRTC’s target speeds of 5 Mbps download and 1 Mbps upload within hexagonal service areas of 25 square kilometres.

Figure 3. Connecting Canadians Broadband Internet Coverage Map of Alberta. Source: Industry Canada16
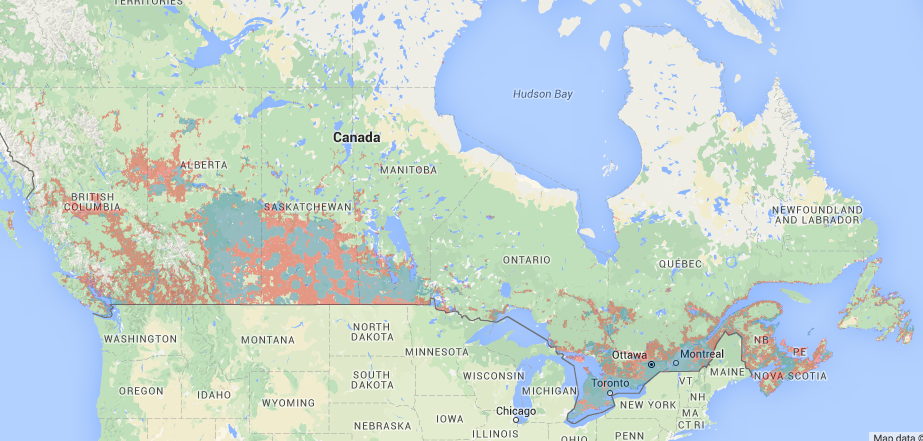
Figure 4. Connecting Canadians Broadband Internet Service Coverage Map of Canada. Source: Industry Canada17
Blue areas indicate regions where internet download speeds of ≥5 Mbps are available and red areas indicate where speeds of <5 Mbps are available. Further raw data is available on the Industry Canada website.

Figure 5. CRTC Broadband Internet Service Coverage in Alberta. Source: CRTC18
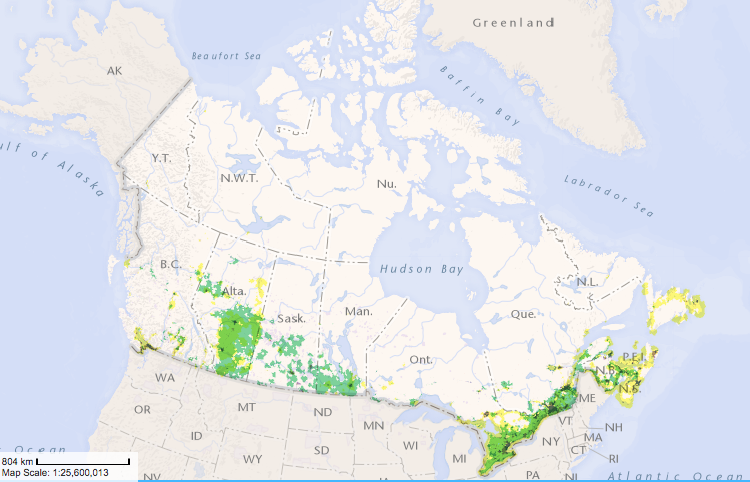
Figure 6. CRTC Broadband Internet Service Coverage in Canada. Source: CRTC 19
Coloured areas indicate availability of internet download/upload speeds of ≥5/1 Mbps. Green represents fixed wireless access and yellow represents LTE access. Note that there is some overlap in this coverage. An interactive map with various layers is available on the CRTC website.
Within the CRTC map, a hexagon is classified as served if at least one household in the 25 square kilometre area has access to internet service at speeds of at least 5 Mbps download and 1 Mbps upload. In the course of our conversations with stakeholders, this mapping methodology received criticism from some fixed wireless ISPs, as it can lead to an overrepresentation of broadband coverage in Alberta. Similar critiques were put on public record at the CRTC’s April 2016 Review of basic telecommunications services hearing.20 The CRTC also notes that: “Internet speeds at or above the CRTC’s targets may not be achievable throughout the entire LTE coverage area.”21
Cybera has further heard from fixed wireless ISPs (whose services cover the largest areas of the maps) that download/upload speeds of ≥ 5/1 Mbps may not be available to all subscribers at all times. Fixed wireless access can be complicated by weather, the distance of the subscriber to a tower, and congestion on the wireless access portion of the network, particularly during peak internet usage periods. Please refer to the Fixed Wireless Access/Wireless Internet Service Providers section of this chapter for more information on wireless access networks in Alberta.
Using the estimate that 98% of the province’s population is covered, this leaves 2% — 80,000 Albertans — without access to internet at speeds of at least 5 Mbps download and 1 Mbps upload. All access rates discussed above do not take into consideration the affordability of broadband service.
Canada’s federal ministries, along with the Canadian Radio and Television Commission (CRTC), have devised a National Broadband internet Service Availability Map (ISAM)7 to show the level of broadband services available in any part of Canada. This map uses a combination of data sources. The data is collected in partnership between the CRTC and the Ministry of Innovation, Science and Economic Development through annual surveys and ongoing consultation with key stakeholders, including ISPs, federal partners, industry associations, provinces and others.8 This is now used as a standard map of services for many internet bandwidth improvement projects and grant funding programs.
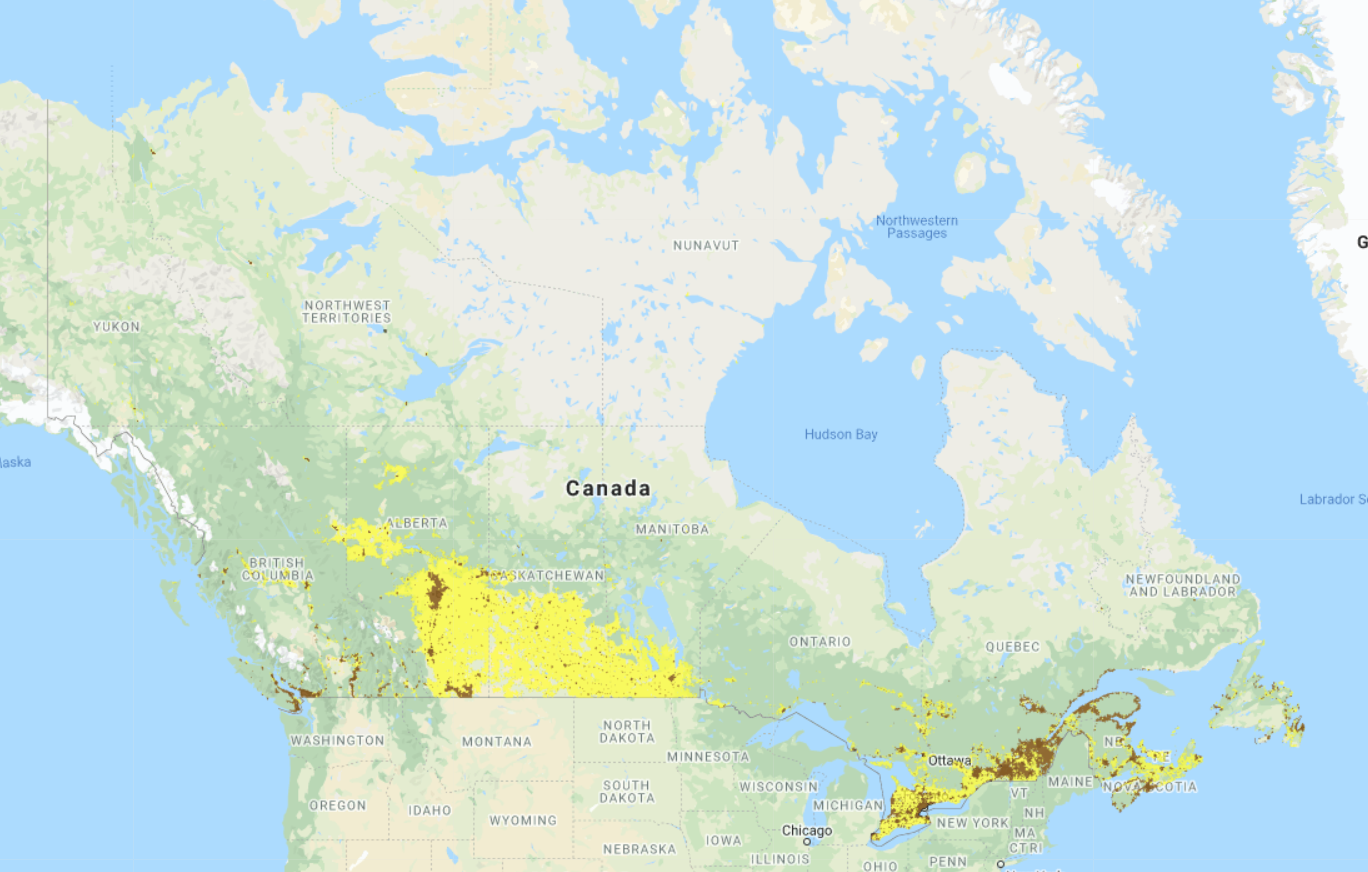
Figure 3. National Broadband Internet Service Availability Map of Canada. Source: Innovation, Science and Economic Development Canada Orange to brown regions indicate increasing percentages of 50/10 Mbps availability. Yellow regions have at least 5/1 Mbps available, as per the legend in Figure 4.
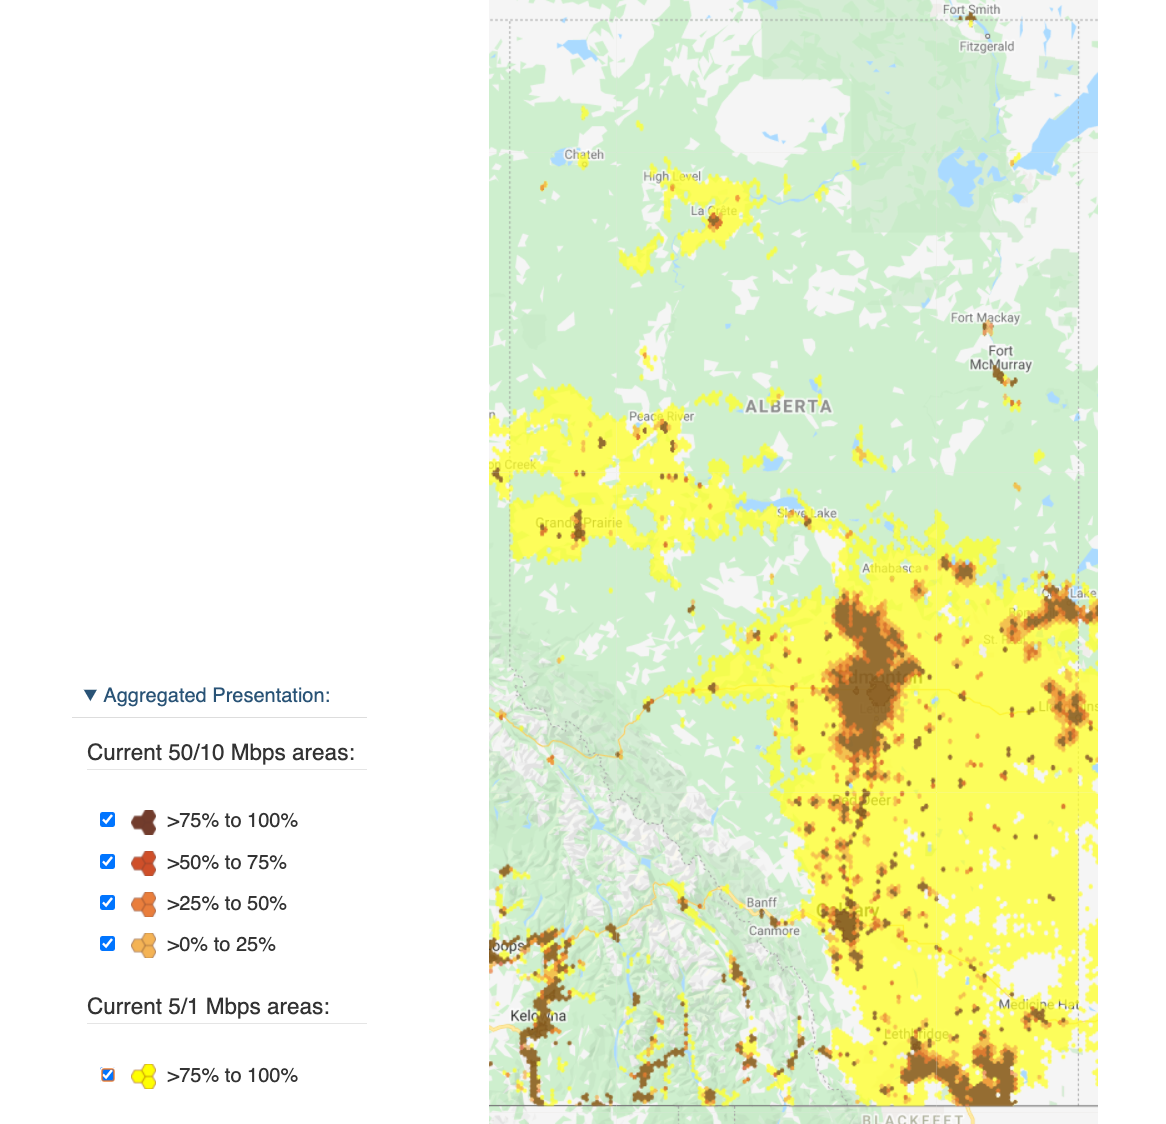
Figure 4. National Broadband Internet Service Availability Map of Alberta. Source: Innovation, Science and Economic Development Canada10
Despite the best efforts of the creators behind ISAM, it is unable to achieve a level of granularity to detail the actual levels of service available in a given geographic region, particularly rural areas. For example, in Sturgeon County, immediately north of Edmonton, the national map shows the majority of the county as being fully served at 50/10 Mbps or better, and the remainder at a minimum of 25/5 Mbps (see Figure 5). And yet, many farmers and acreage owners in the county are significantly underserved. This can be shown from data captured by the Canadian Internet Registration Authority (CIRA) using its Internet Performance Test (IPT)11.
CIRA is a non-profit organization tasked with maintaining internet domains in Canada, along with a host of other related services. Its IPT service allows internet subscribers to test the actual bandwidth performance of their internet. It is independent of any other data, such as those used by ISAM, and provides real-time data capture. The speed test data CIRA produces comes from hundreds of thousands of data points from around the country.
Cybera acquired CIRA’s IPT data for Alberta for the years 2019 and 2020, and has used samples of this data to determine the accuracy of the ISAM information. It should be noted that individual network tests are not always a good indicator of a given network’s performance. This is because bandwidth and other network performance indicators — such latency and jitter (lag in data packet delivery and consistent flow of data) — can be dependent on many factors. Nevertheless, the volume of results in a given area from the IPT data can produce averages based on different locations on different connection types and different times of the day and the season. This data then is very telling.
Below is a section of Sturgeon County captured from the ISAM website. When zooming in from the large-scale maps, you get what ISAM calls “Rural Road Coverage”, as shown in Figure 5. This shows expected service levels available along these roads, which means the entire area is identified as having service levels at a minimum of at least 25/5 Mbps, if not 50/10 Mbps.
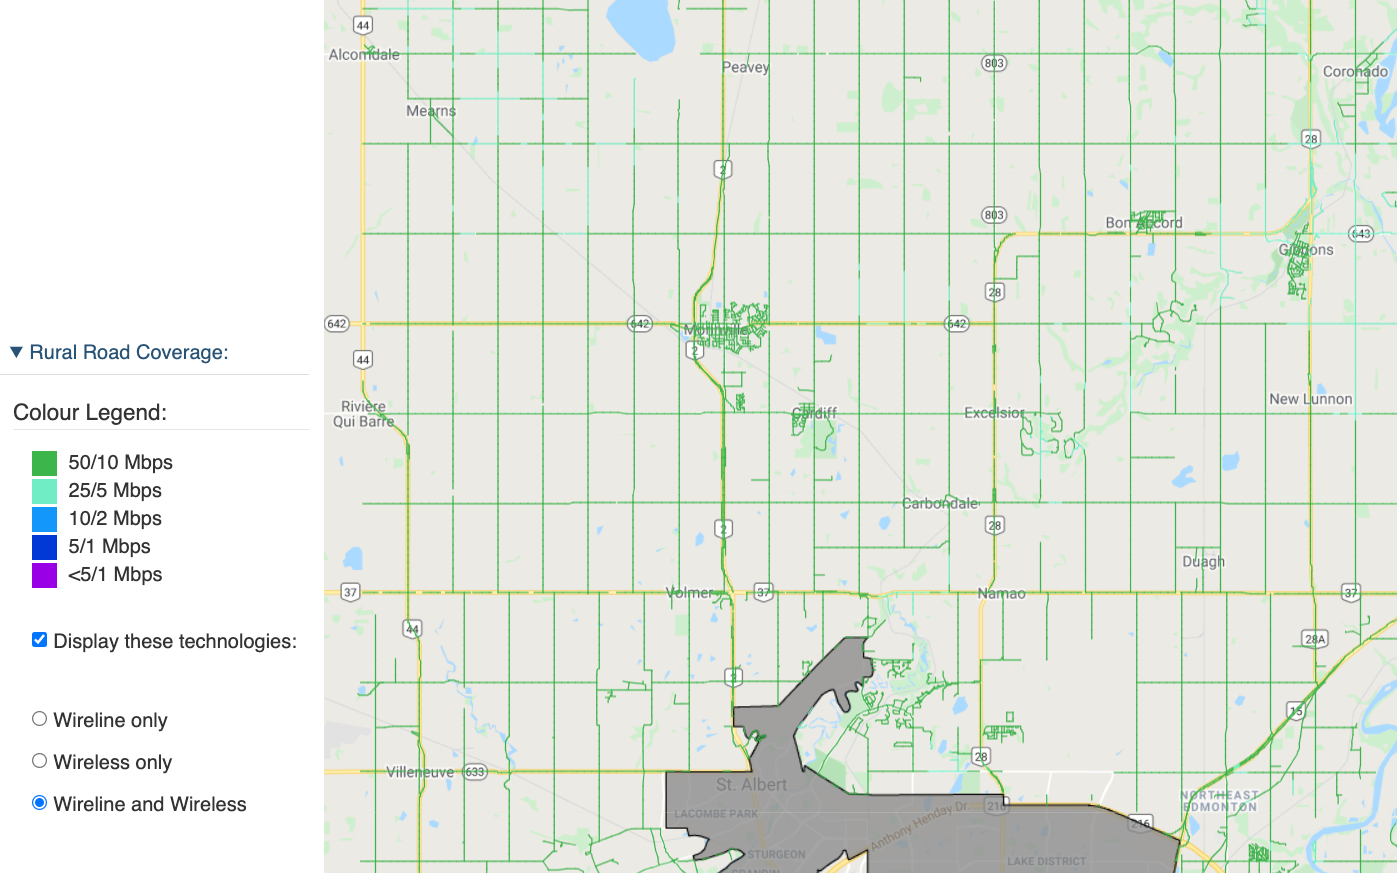
Figure 5. Zoomed-in area of the National Broadband Internet Service Availability Map (ISAM). This shows a portion of Sturgeon County immediately north of Edmonton and St. Albert (grey areas). The Rural Road Coverage shows green lines along the roads indicating full coverage of 50/10 Mbps in the county. Source: Innovation, Science and Economic Development Canada12
Compare that view of the area with the data provided by CIRA’s IPT data, shown in Figure 6. Using the same legend as ISAM, the results show a much more diverse level of service availability, with a number of locations getting results at less than 5/1 Mbps service availability.
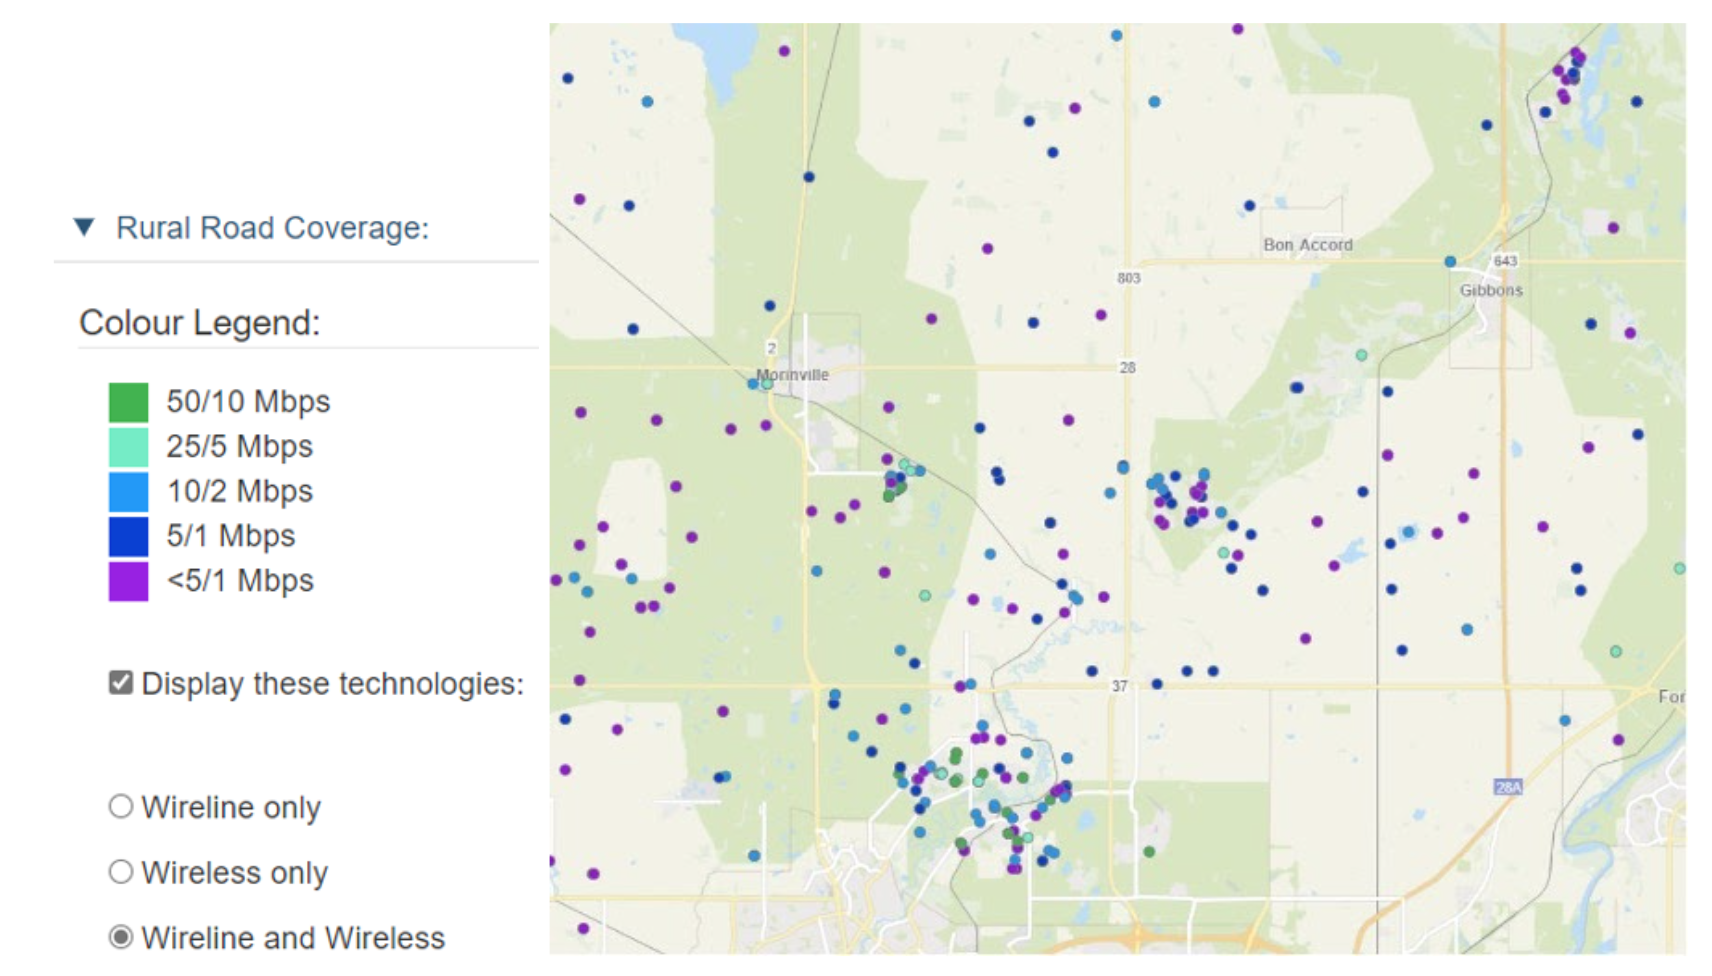
Figure 6. CIRA’s Internet Performance Test (IPT) data shows the same section of Sturgeon County as Figure 5, with test results from individual source locations. There are many data points showing less than 50/10 Mbps and even well below 25/5 Mbps as shown in the ISAM image. Source: Canadian Internet Registration Authority IPT data.13
The CRTC Communications Monitoring Report (Table 1) shows broadband availability percentages for Alberta based on the ISAM data, which gives a broad strokes picture of broadband coverage. CIRA’s IPT data can help improve the granularity of the actual broadband service availability in any specific geographic region. Using both of these tools to analyze broadband service availability for a given region, say, to apply for grant funding opportunities, should greatly improve the understanding of the actual availability in any region. This will be further discussed in the Future Needs and Opportunities section of this report.
References
6CRTC. Communications Monitoring Report - 2020, Table 4.2, p. 107. Accessed 01 January 2021.
7Innovation, Science and Economic Development (ISED) Canada. National Broadband Internet Service Availability Map.
8ISED. National Broadband Data Information - Get connected (ic.gc.ca).
9ISED. National Broadband Internet Service Availability Map. Accessed 15 June 2021.
10ISED. National Broadband Internet Service Availability Map. Accessed 15 June 2021.
11Canadian Internet Registration Authority (CIRA). Internet Performance Test | CIRA.
12ISED. National Broadband Internet Service Availability Map. Accessed 15 June 2021.
13CIRA Performance Test data from 2019 and 2020
References
7. Government of Alberta. Alberta leads in access to high speed internet, 6 December 2013. Accessed 1 June 2016.
8. Service Alberta. How It Works. Accessed 1 June 2016.
9. CRTC. Communications Monitoring Report, Table 5.3.13, p. 210. Accessed 4 July 2016.
10. CRTC. Communications Monitoring Report, Figure 5.3.14, p. 207. Accessed 4 July 2016.
11. CIRA. Canada’s Internet Performance: National, Provincial, and Municipal Analysis. April 2016. Accessed 20 July 2016.
12. Industry Canada. About Connecting Canadians, 26 June 2016. Accessed 1 June 2016.
13. Industry Canada. Digital Canada 150 - Northern Component, 20 May 2015. Accessed 4 July 2016.
14. Government of Canada News. Connecting Canadians, 8 April 2016. Accessed 29 May 2016.
15. Industry Canada. Digital Canada 150: Connecting Canadians - Could your area benefit? 18 November, 2014. Accessed 1 June 2016.
16. Industry Canada. Digital Canada 150: Connecting Canadians - Could your area benefit? 18 November, 2014. Accessed 1 June 2016.
17. Industry Canada. Digital Canada 150: Connecting Canadians - Could your area benefit? 18 November, 2014. Accessed 1 June 2016.
18. CRTC. Broadband Internet Service Coverage in Canada, 20 April 2016. Accessed 6 June 2016.
19. CRTC. Broadband Internet Service Coverage in Canada, 20 April 2016. Accessed 6 June 2016.
20. CRTC. Transcript, Hearing, April 11 2016, line 1681. Accessed 2 June 2016.
21. CRTC. Broadband Internet Service Coverage in Canada, 20 April 2016. Accessed 6 June 2016.